Geographical Information System Day was observed Wednesday in the lobbies of city hall and the Liberty County Annex.
Residents were able view a gallery of maps and see what information is available from GIS programs used by the city and the county.
According to the Economic and Social Research Institute’s website, www.esri.com, GIS integrates hardware, software and data that can be used to capture, manage, analyze and display geographical information. Locally, GIS Day has been observed Wednesday during National Geographic Society’s Geography Awareness Week, said Anna Phillips, coordinator with the Hinesville inspection department’s GIS office. Phillips said Hinesville has observed GIS Day since she started working for the city 10 years ago and that industrywide, GIS Day has been observed for the past 15 years after starting 50 years ago in Canada.
Jay Johnson, GIS technician with the mapping department of the Liberty County Tax Assessor’s office, said his department primarily uses GIS to create maps that track information on properties.
“Today, we’re trying to spread awareness about our website,” Johnson said. “We average 90-150 people a day who use our website.”
Research assistant Tamara Hegi said Wednesday is the busiest day for website visits, with Monday and Friday the least visited days. The link to the website can be found on the Liberty County website; visitors should select “E-Services,” then “View Property Tax Information.” The new page will show a gold icon link for the tax assessor and a green icon link for their “New PRISYM Viewer.” He said PRISYM stands for property information system.
Johnson pointed to a large map with several small “quick-response codes” that mark key properties in the county. He said residents can use a smartphone to scan these codes and download the information from a particular site. In addition to tax information, he said tax maps generated by his office also are used by the Liberty Consolidated Planning Commission for zoning and for determining routes for the Liberty Transit System.
Mike Johnson, city GIS technician, said his office uses GIS to produce maps that provide specific information about city projects and services, including location of city utilities like water and sewer lines. Maps showing restaurant locations and city council districts also are available.
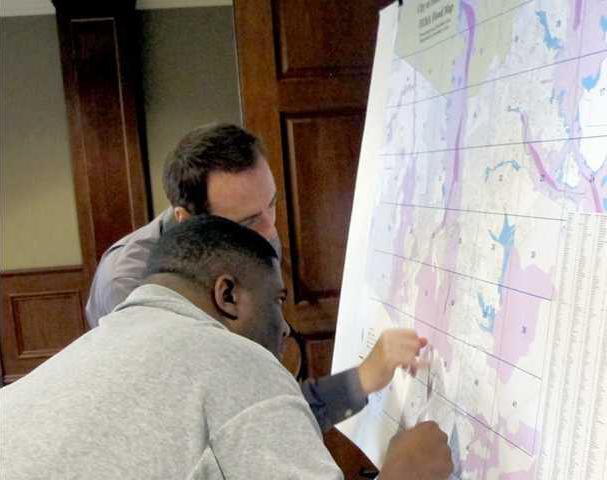
He said during Wednesday’s event that one of the most popular maps shows the location of crimes committed in the city in October. Another favorite map of local residents is a Federal Emergency Management Agency flood map that shows flood zones within city limits.
“It looks like you’re in the clear,” Johnson told Hinesville resident Charles Morreale as he pointed to a spot on the big map just over the line from the purple area signifying a flood zone. “This is Ashton Drive right here. You’re not in the flood zone.”
Phillips said her staff members are not formally trained in surveying. Johnson added that with maps like the flood-zone map, the department receives coordinates from FEMA and puts that data into its system to create maps that people can understand and use.
“In this office, I have global positioning satellite (coordinates) for the city’s fire hydrants, manhole covers, storm water drains, street signs, you name it,” Phillips said. “We’re here to provide the city (with mapping and GIS services). Today, we’re here to educate the public about what GIS is used for.”
For more information about GIS services within the city, call 876-4147. For the county, email jay.johnson@libertycountyga.com or scott.wall@libertycountyga.com.
County, city mappers show was GIS can do